Scalable AI Deployment: Harnessing OpenVINO and NGINX Plus for Efficient Inference
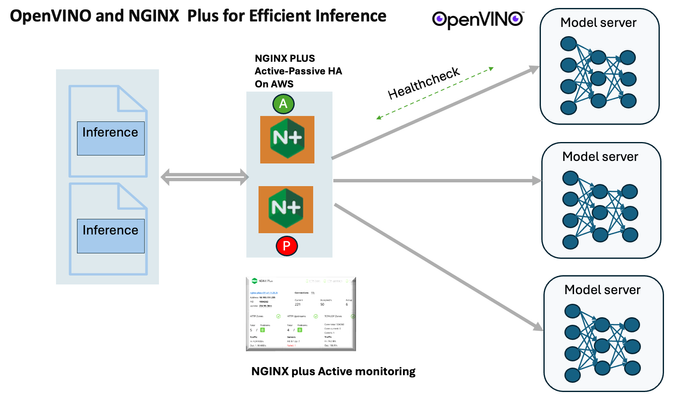
Introduction In the realm of artificial intelligence (AI) and machine learning (ML), the need for scalable and efficient AI inference solutions is paramount. As organizations deploy increasingly complex AI models to solve real-world problems, ensuring that these models can handle high volumes of inference requests becomes critical. NGINX Plus serves as a powerful ally in managing incoming traffic efficiently. As a high-performance web server and reverse proxy server, NGINX Plus is adept at load balancing and routing incoming HTTP and TCP traffic across multiple instances of AI model serving environments. The OpenVINO Model Server, powered by Intel's OpenVINO toolkit, is a versatile inference server supporting various deep learning frameworks and hardware acceleration technologies. It allows developers to deploy and serve AI models efficiently, optimizing performance and resource utilization. When combined with NGINX Plus capabilities, developers can create resilient and scalable AI inference solutions capable of handling high loads and ensuring high availability. Health checks allow NGINX Plus to continuously monitor the health of the upstream OVMS instances. If an OVMS instance becomes unhealthy or unresponsive, NGINX Plus can automatically route traffic away from it, ensuring that inference requests are processed only by healthy OVMS instances. Health checks provide real-time insights into the health status of OVMS instances. Administrators can monitor key metrics such as response time, error rate, and availability, allowing them to identify and address issues proactively before they impact service performance. In this article, we'll delve into the symbiotic relationship between the OpenVINO Model Server, and NGINX Plus to construct a robust and scalable AI inference solution. We'll explore setting up the environment, configuring the model server, harnessing NGINX Plus for load balancing, and conducting testing. By the end, readers will gain insights into how to leverage Docker, the OpenVINO Model Server, and NGINX Plus to build scalable AI inference systems tailored to their specific needs. Flow explanation: Now, let's walk through the flow of a typical inference request. When a user submits an image of a zebra for inference, the request first hits the NGINX load balancer. The load balancer then forwards the request to one of the available OpenVINO Model Server containers, distributing the workload evenly across multiple containers. The selected container processes the image using the optimized deep-learning model and returns the inference results to the user. In this case, the object is named zebra. OpenVINO™ Model Server is a scalable, high-performance solution for serving machine learning models optimized for Intel® architectures. The server provides an inference service via gRPC, REST API, or C API -- making it easy to deploy new algorithms and AI experiments. You can visit https://hub.docker.com/u/openvino for reference. Setting up: We'll begin by deploying model servers within containers. For this use case, I'm deploying the model server on a virtual machine (VM). Let's outline the steps to accomplish this: Get the docker image for OpenVINO ONNX run time docker pull openvino/onnxruntime_ep_ubuntu20 You can also visit https://docs.openvino.ai/nightly/ovms_docs_deploying_server.html for OpenVINO model server deployment in a container environment. Begin by creating a docker-compose file following the structure below: https://raw.githubusercontent.com/f5businessdevelopment/F5openVino/main/docker-compose.yml version: '3' services: resnet1: image: openvino/model_server:latest command: > --model_name=resnet --model_path=/models/resnet50 --layout=NHWC:NCHW --port=9001 volumes: - ./models:/models ports: - "9001:9001" resnet2: image: openvino/model_server:latest command: > --model_name=resnet --model_path=/models/resnet50 --layout=NHWC:NCHW --port=9002 volumes: - ./models:/models ports: - "9002:9002" # Add more services for additional containers resnet3: image: openvino/model_server:latest command: > --model_name=resnet --model_path=/models/resnet50 --layout=NHWC:NCHW --port=9003 volumes: - ./models:/models ports: - "9003:9003" resnet4: image: openvino/model_server:latest command: > --model_name=resnet --model_path=/models/resnet50 --layout=NHWC:NCHW --port=9004 volumes: - ./models:/models ports: - "9004:9004" resnet5: image: openvino/model_server:latest command: > --model_name=resnet --model_path=/models/resnet50 --layout=NHWC:NCHW --port=9005 volumes: - ./models:/models ports: - "9005:9005" resnet6: image: openvino/model_server:latest command: > --model_name=resnet --model_path=/models/resnet50 --layout=NHWC:NCHW --port=9006 volumes: - ./models:/models ports: - "9006:9006" resnet7: image: openvino/model_server:latest command: > --model_name=resnet --model_path=/models/resnet50 --layout=NHWC:NCHW --port=9007 volumes: - ./models:/models ports: - "9007:9007" resnet8: image: openvino/model_server:latest command: > --model_name=resnet --model_path=/models/resnet50 --layout=NHWC:NCHW --port=9008 volumes: - ./models:/models ports: - "9008:9008" Make sure you have Docker and Docker Compose installed on your system. Place your model files in the `./models/resnet50` directory on your local machine. Save the provided Docker Compose configuration to a file named `docker-compose.yml`. Run the following command in the directory containing the `docker-compose.yml` file to start the services: docker-compose up -d You can now access the OpenVINO Model Server instances using the specified ports (e.g., `http://localhost:9001` for `resnet1` and `http://localhost:9002` for `resnet2`). - Ensure that the model files are correctly placed in the `./models/resnet50` directory before starting the services. Set up an NGINX Plus proxy server. You can refer to https://docs.nginx.com/nginx/admin-guide/installing-nginx/installing-nginx-plus/ for NGINX Plus installation also You have the option to configure VMs with NGINX Plus on AWS by either: Utilizing the link provided below, which guides you through setting up NGINX Plus on AWS via the AWS Marketplace: NGINX Plus on AWS Marketplace or Following the instructions available on GitHub at the provided repository link. This repository facilitates spinning up VMs using Terraform on AWS and deploying VMs with NGINX Plus under the GitHub repository - F5 OpenVINO The NGINX Plus proxy server functions as a proxy for upstream model servers. Within the upstream block, backend servers (model_servers) are defined along with their respective IP addresses and ports. In the server block, NGINX listens on port 80 to handle incoming HTTP/2 requests targeting the specified server name or IP address. Requests directed to the root location (/) are then forwarded to the upstream model servers utilizing the gRPC protocol. The proxy_set_header directives are employed to maintain client information integrity while passing requests to the backend servers. Ensure to adjust the IP addresses, ports, and server names according to your specific setup. Here is an example configuration that is also available at GitHubhttps://github.com/f5businessdevelopment/F5openVino upstream model_servers { server 172.17.0.1:9001; server 172.17.0.1:9002; server 172.17.0.1:9003; server 172.17.0.1:9004; server 172.17.0.1:9005; server 172.17.0.1:9006; server 172.17.0.1:9007; server 172.17.0.1:9008; zone model_servers 64k; } server { listen 80 http2; server_name 10.0.0.19; # Replace with your domain or public IP location / { grpc_pass grpc://model_servers; health_check type=grpc grpc_status=12; # 12=unimplemented proxy_set_header Host $host; proxy_set_header X-Real-IP $remote_addr; proxy_set_header X-Forwarded-For $proxy_add_x_forwarded_for; } } If you are using gRPC with SSL please refer to the detailed configuration at NGINX Plus SSL Configuration Here is the explanation: upstream model_servers { server 172.17.0.1:9001; # Docker bridge network IP and port for your container server 172.17.0.1:9002; # Docker bridge network IP and port for your container .... .... } This section defines an upstream block named model_servers, which represents a group of backend servers. In this case, there are two backend servers defined, each with its IP address and port. These servers are typically the endpoints that NGINX will proxy requests to. server { listen 80 http2; server_name 10.1.1.7; # Replace with your domain or public IP This part starts with the main server block. It specifies that NGINX should listen for incoming connections on port 80 using the HTTP/2 protocol (http2), and it binds the server to the IP address 10.1.1.7. Replace this IP address with your domain name or public IP address. location / { grpc_pass grpc://model_servers; health_check type=grpc grpc_status=12; # 12=unimplemented proxy_set_header Host $host; proxy_set_header X-Real-IP $remote_addr; proxy_set_header X-Forwarded-For $proxy_add_x_forwarded_for; } Within the location/block, NGINX defines how to handle requests to the root location. In this case, it's using gRPC (grpc_pass grpc://model_servers;) to pass the requests to the upstream servers defined in the model_servers block. The proxy_set_header directives are used to set headers that preserve client information when passing requests to the backend servers. These headers include Host, X-Real-IP, and X-Forwarded-For. Health checks with type=grpc enable granular monitoring of individual gRPC services and endpoints. You can verify the health of specific gRPC methods or functionalities, ensuring each service component is functioning correctly. In summary, this NGINX configuration sets up a reverse proxy server that listens for HTTP/2 requests on port 80 and forwards them to backend servers (model_servers) using the gRPC protocol. It's commonly used for load balancing or routing requests to multiple backend servers. Inference Testing: This is how you can conduct testing. On the client side, we utilize a script named predict.py. Below is the script for reference # Import necessary libraries import numpy as np from classes import imagenet_classes from ovmsclient import make_grpc_client # Create a gRPC client to communicate with the server # Replace "10.1.1.7:80" with the IP address and port of your server client = make_grpc_client("10.1.1.7:80") # Open the image file "zebra.jpeg" in binary read mode with open("zebra.jpeg", "rb") as f: img = f.read() # Send the image data to the server for prediction using the "resnet" model output = client.predict({"0": img}, "resnet") # Extract the index of the predicted class with the highest probability result_index = np.argmax(output[0]) # Print the predicted class label using the imagenet_classes dictionary print(imagenet_classes[result_index]) This script imports necessary libraries, establishes a connection to the server at the specified IP address and port, reads an image file named "zebra.jpeg," sends the image data to the server for prediction using the "resnet" model, retrieves the predicted class index with the highest probability, and prints the corresponding class label. Results: Execute the following command from the client machine. Here, we are transmitting this image of Zebra to the model server. python3 predict.py zebra.jpg #run the Inference traffic zebra. The prediction output is 'zebra'. Let's now examine the NGINX Plus logs cat /var/log/nginx/access.log 10.1.1.7 - - [13/Apr/2024:00:18:52 +0000] "POST /tensorflow.serving.PredictionService/Predict HTTP/2.0" 200 4033 "-" "grpc-python/1.62.1 grpc-c/39.0.0 (linux; chttp2)" This log entry shows that a POST request was made to the NGINX server at the specified timestamp, and the server responded with a success status code (200). The request was made using gRPC, as indicated by the user agent string. Conclusion: Using NGINX Plus, organizations can achieve a scalable and efficient AI inference solution. NGINX Plus can address disruptions caused by connection timeouts/errors, sudden spikes in request rates, or changes in network topology. OpenVINO Model Server optimizes model performance and inference speed, utilizing Intel hardware acceleration for enhanced efficiency. NGINX Plus acts as a high-performance load balancer, distributing incoming requests across multiple model server instances for improved scalability and reliability. Together, this enables seamless scaling of AI inference workloads, ensuring optimal performance and resource utilization. You can look at this video for reference: https://youtu.be/Sd99woO9FmQ References: https://hub.docker.com/u/openvino https://docs.nginx.com/nginx/deployment-guides/amazon-web-services/high-availability-keepalived/ https://www.nginx.com/blog/nginx-1-13-10-grpc/ https://github.com/f5businessdevelopment/F5openVino.git https://docs.openvino.ai/nightly/ovms_docs_deploying_server.html298Views0likes0Comments
Getting Started with iRules LX, Part 4: NPM & Best Practices
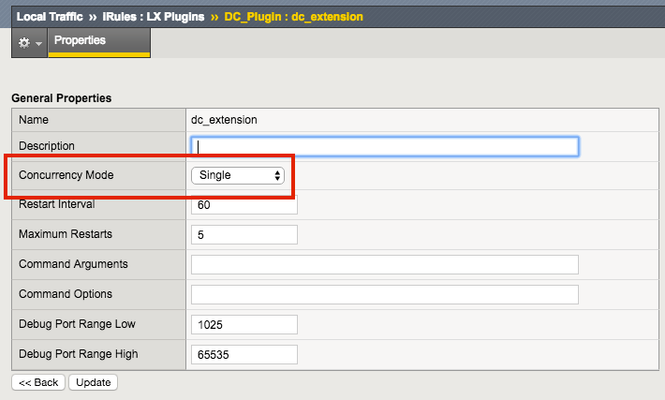
So far in this series we've covered basic nomenclature and concepts, and in the last article actually dug into the code that makes it all work. At this point, I'm sure the wheels of possibilities are turning in your minds, cooking up all the nefarious interesting ways to extend your iRules repertoire. The great thing about iRules LX, as we'll discuss in the onset of this article, is that a lot of the heavy lifting has probably already been done for you. The Node.js package manager, or NPM, is a living, breathing, repository of 280,000+ modules you won't have to write yourself should you need them! Sooner or later you will find a deep desire or maybe even a need to install packages from NPM to help fulfill a use case. Installing packages with NPM NPM on BIG-IP works much of the same way you use it on a server. We recommend that you not install modules globally because when you export the workspace to another BIG-IP, a module installed globally won't be included in the workspace package. To install an NPM module, you will need to access the Bash shell of your BIG-IP. First, change directory to the extension directory that you need to install a module in. Note: F5 Development DOES NOT host any packages or provide any support for NPM packages in any way, nor do they provide security verification, code reviews, functionality checks, or installation guarantees for specific packages. They provide ONLY core Node.JS, which currently, is confined only to versions 0.12.15 and 6.9.1. The extension directory will be at /var/ilx/workspaces/<partition_name>/<workspace_name>/extensions/<extension_name>/ . Once there you can run NPM commands to install the modules as shown by this example (with a few ls commands to help make it more clear) - [root@test-ve:Active:Standalone] config # cd /var/ilx/workspaces/Common/DevCentralRocks/extensions/dc_extension/ [root@test-ve:Active:Standalone] dc_extension # ls index.js node_modules package.json [root@test-ve:Active:Standalone] dc_extension # npm install validator --save validator@5.3.0 node_modules/validator [root@test-ve:Active:Standalone] dc_extension # ls node_modules/ f5-nodejs validator The one caveat to installing NPM modules on the BIG-IP is that you can not install native modules. These are modules written in C++ and need to be complied. For obvious security reasons, TMOS does not have a complier. Best Practices Node Processes It would be great if you could spin up an unlimited amount of Node.js processes, but in reality there is a limit to what we want to run on the control plane of our BIG-IP. We recommend that you run no more than 50 active Node processes on your BIG-IP at one time (per appliance or per blade). Therefore you should size the usage of Node.js accordingly. In the settings for an extension of a LX plugin, you will notice there is one called concurrency - There are 2 possible concurrency settings that we will go over. Dedicated Mode This is the default mode for all extensions running in a LX Plugin. In this mode there is one Node.js process per TMM per extension in the plugin. Each process will be "dedicated" to a TMM. To know how many TMMs your BIG-IP has, you can run the following TMSH command - root@(test-ve)(cfg-sync Standalone)(Active)(/Common)(tmos) # show sys tmm-info | grep Sys::TMM Sys::TMM: 0.0 Sys::TMM: 0.1 This shows us we have 2 TMMs. As an example, if this BIG-IP had a LX plugin with 3 extensions, I would have a total of 6 Node.js processes. This mode is best for any type of CPU intensive operations, such as heavy parsing data or doing some type of lookup on every request, an application with massive traffic, etc. Single Mode In this mode, there is one Node.js process per extension in the plugin and all TMMs share this "single" process. For example, one LX plugin with 3 extensions will be 3 Node.js processes. This mode is ideal for light weight processes where you might have a low traffic application, only do a data lookup on the first connection and cache the result, etc. Node.js Process Information The best way to find out information about the Node.js processes on your BIG-IP is with the TMSH command show ilx plugin . Using this command you should be able to choose the best mode for your extension based upon the resource usage. Here is an example of the output - root@(test-ve)(cfg-sync Standalone)(Active)(/Common)(tmos) # show ilx plugin DC_Plugin --------------------------------- ILX::Plugin: DC_Plugin --------------------------------- State enabled Log Publisher local-db-publisher ------------------------------- | Extension: dc_extension ------------------------------- | Status running | CPU Utilization (%) 0 | Memory (bytes) | Total Virtual Size 1.1G | Resident Set Size 7.7K | Connections | Active 0 | Total 0 | RPC Info | Total 0 | Notifies 0 | Timeouts 0 | Errors 0 | Octets In 0 | Octets Out 0 | Average Latency 0 | Max Latency 0 | Restarts 0 | Failures 0 --------------------------------- | Extension Process: dc_extension --------------------------------- | Status running | PID 16139 | TMM 0 | CPU Utilization (%) 0 | Debug Port 1025 | Memory (bytes) | Total Virtual Size 607.1M | Resident Set Size 3.8K | Connections | Active 0 | Total 0 | RPC Info | Total 0 | Notifies 0 | Timeouts 0 | Errors 0 | Octets In 0 | Octets Out 0 | Average Latency 0 | Max Latency 0 From this you can get quite a bit of information, including which TMM the process is assigned to, PID, CPU, memory and connection stats. If you wanted to know the total number of Node.js processes, that same command will show you every process and it could get quite long. You can use this quick one-liner from the bash shell (not TMSH) to count the Node.js processes - [root@test-ve:Active:Standalone] config # tmsh show ilx plugin | grep PID | wc -l 16 File System Read/Writes Since Node.js on BIG-IP is pretty much stock Node, file system read/writes are possible but not recommended. If you would like to know more about this and other properties of Node.js on BIG-IP, please see AskF5 Solution ArticleSOL16221101. Note:NPMs with symlinks will no longer work in 14.1.0+ due to SELinux changes In the next article in this series we will cover troubleshooting and debugging.2.5KViews1like4CommentsThe App Delivery Fabric with Secure Multicloud Networking
This tutorial with accompanying workflow guide deploys customer edge sites and uses Distributed Cloud Multicloud Networking App Connect to establish a Secure MCN App Delivery Fabric, enabling only Layer7 app connectivity between two cloud sites. Manual and automation workflows show how to make this NetOps and DevOps task come to life.152Views1like0CommentsUsing Distributed Application Security Policies in Secure Multicloud Networking Customer Edge Sites
This tutorial and workflow guide deploys and uses F5 Distributed Cloud App Security policies with apps at local customer edge sites. Deploy a policy in any customer edge site regardless of location in the cloud or on-prem. Manual and automation workflows show how to make this NetOps and DevOps friendly solution come to life.221Views0likes0CommentsHow I did it - "Securing Nvidia Triton Inference Server with NGINX Plus Ingress Controller”
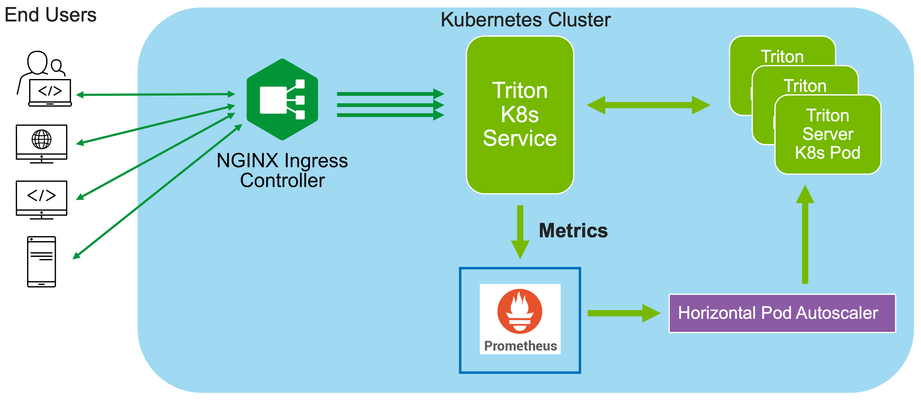
In this installment of "How I Dit it", we step into the world of AI and Machine learning (ML) and take a look at how F5’s NGINX Plus Ingress Controller can provide secure and scalable external access to Nvidia’s Triton Inference Servers hosted on Kubernetes.248Views0likes0CommentsHow To Run Ollama On F5 AppStack With An NVIDIA GPU In AWS
If you're just getting started with AI, you'll want to watch this one, as Michael Coleman shows Aubrey King, from DevCentral, how to run Ollama on F5 AppStack on an AWS instance with an NVIDIA Tesla T4 GPU. You'll get to see the install, what it looks like when a WAF finds a suspicious conversation and even a quick peek at how Mistral handles a challenge differently than Gemma. 75Views2likes0Comments
F5 BIG-IP deployment with OpenShift - per-application 2-tier deployments
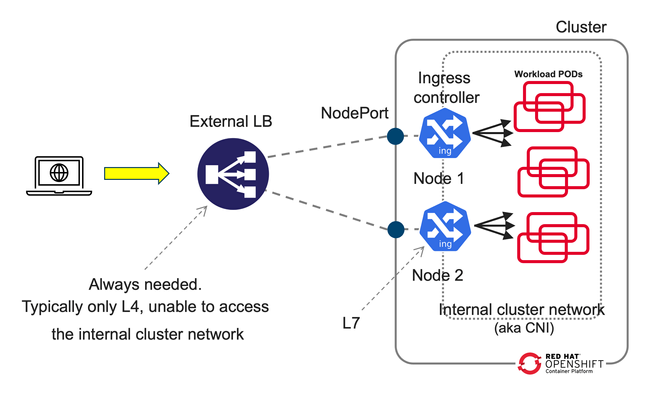
Introduction This article dives deeper in 2-tier deployments introduced in the previous article F5 BIG-IP deployment with OpenShift - platform and networking options yet we will start comparing a common Kubernetes/OpenShift architecture with a more capable and flexible architecture using BIG-IP. Although this type of deployment can be done with the BIG-IP in Layer 4 (L4) mode this article will focus in using the BIG-IP in Layer 7 (L7) mode which allows for more functionality and flexibility. A regular Kubernetes/OpenShift deployment is as follows: Typically, the External LB doesn´t add much added value and just spreads the connections across the ingress controller instances without any service intelligence. This article emphasizes on the added value of F5 BIG-IP with Container Ingress Services (CIS) by operating at L7. Additionally, it is described how CIS is ingress agnostic and can be used at is fullest regardless of the ingress controller, API manager, service mesh used, or even a combination of these! This 2-tier architecture can be seen next, where it is not only shown that traffic is sent directly to the ingress controllers without the NodePort indirection. In the figure, it can also be seen compared to a 1-tier architecture: ClusterIP and NodePort When using a 2-tier deployment, a key aspect that needs to be decided is how it is going to be sent the traffic to the ingress controllers. NodePort With other External LB solutions (ELB), the common way to send traffic to the ingress controllers in Kubernetes is by exposing these as NodePort. This option always works because the ELB doesn't need to deal with the CNI. In this case, when the ELB sends traffic to a node, the NodePort construct by default load balances the traffic to any node in the cluster where the ingress controller is. This means that there would be 3 hops before reaching the workload POD. These hops are: the ELB, the ingress controller, the NodePort, and finally the workload POD. This NodePort load balancing to other nodes can be removed by changing the externalTrafficPolicy from Cluster to Local in the Service definition. Thus reducing the number of hops from 3 to 2. ClusterIP Alternatively, the BIG-IP can send the traffic directly to the POD addresses, aka ClusterIP mode, without any translation or Kubernetes construct in between the BIG-IP and the ingress controller. This is specified in CIS with the --pool-member-type=cluster option and requires support of the CNI. Using OpenShiftSDN and ClusterIP is discouraged because this CNI is being deprecated and will not be covered in this article. When using OVNKubernetes, the BIG-IP sends the traffic without any tunnelling. At this moment, this requires that the clusters are in the same subnet as the BIG-IP. Which option to choose? If the OpenShift cluster is not in the same subnet as the BIG-IP or if the infrastructure doesn´t allow POD addresses traverse the segment (ie: because of a L2 firewall/micro-segmentation), then NodePort would need to be used. I would discourage the use of NodePort with externalTrafficPolicy: Cluster because it doesn´t allow to do adequate health check monitoring because each probe will be sent to a different ingress controller. Moreover, persistence and troubleshooting is more tricky too because of the additional hop that NodePort creates. If NodePort needs to be used, then externalTrafficPolicy: Local referencing the ingress controllers is recommended. If there is no problem in routing the traffic to the OpenShift nodes using the POD addresses, I would encourage using ClusterIP because it is a transparent method, where the application traffic is easier to track: there are no additional hops or address translations. OpenShift´s bundled ingress/router is HA-proxy; In on-prem OpenShift deployments, the default router instance is created using hostNetwork access. HostNetwork can also be used with CIS --pool-member-type=cluster mode. The IP addresses of the pool members will be the node addresses, but there will not be any indirection to the POD. The examples provided in the git repository mentioned in this article use ClusterIP but can be easily modified to NodePort if necessary. 2-tier per-service load balancing and health checking This type of deployment requires that the external load balancer, in this case the F5 BIG-IP, can take actions based on the L7 route path. This includes health-checking the application and performing TLS/SSL termination. From a Kubernetes/OpenShift point of view, the most remarkable is that it is needed to expose the L7 routes twice. That is, for a given L7 route there will be a manifest for the ingress controller and another L7 route manifest for CIS. This is outlined in the next figure: In the above figure, there is only one ingress controller instance with several replicas serving the same L7 routes. It is not relevant which ingress controller it is. This ingress controller can have defined its L7 routes with any resource type. This is transparent from the point of view of CIS. CIS only requires that the ingress controller can be referenced with a selector from a Service. This service is shown in brown. There will be a Service manifest for each L7 route for CIS. Even if all these services point to the same ingress controller instances. This allows you to: Monitor each L7 route´s backends individually. Have a clean NetOps/DevOps separation where DevOps can manipulate the ingress controller configurations freely and NetOps can control the publishing of these in the ELB. Ultimately make load-balancing decisions in a per-application basis The L7 routes for CIS can be defined either as VirtualServer, Route (as NextGen Route) or as Ingress resource types. Using the Ingress resource type is not recommended because of its limited functionalities compared with the other types. Overall, there will be a 1:1:1 mapping between the L7 routes defined for CIS, the Service manifests referenced by CIS´ L7 routes, and the L7 routes defined for the ingress controller. This is shown conceptually in the next figure. With respect to load balancing algorithm, given that the number of ingress controllers in a two-tier deployment is typically small it is sensible to take into account the load of each ingress controller by using an algorithm such as least-connections, least-sessions (if using persistence) or fastest (application response time) which should send more traffic to the ingress controller which is performing better or in other words, would avoid sending more traffic to an ingress controller that is not performing well. Unify all ingresses in a single VIP Thanks to CIS being ingress controller agnostic, it is also possible to combine L7 routes from different ingress controllers, these can be a mix of one or more ingress controllers, including service mesh ingress or API managers. This brings the flexibility of exposing L7 routes from these sources in a single VIP, as shown in the next figure. From the picture above, it can be seen how in this arrangement the ingress controllers are not limited to a single L7 route. Also note that as mentioned previously, it is needed to have a 1:1 mapping between the L7 routes defined in the BIG-IP (1st tier) and in the in-cluster ingress element (2nd tier). By default, these paired L7 routes are expected to match their URL. If necessary, it is possible to do URL translation by using the hostRewrite and rewrite attributes in the VirtualServer CR. OpenShift´s documentation mentions several use cases for creating additional OpenShift router (HA-proxy) instances, referred to as route sharding. These are: Balance Ingress Controllers, or routers, with several routes to speed up responses to changes. Allocate certain routes to have different reliability guarantees than other routes. Allow certain Ingress Controllers to have different policies defined. Allow only specific routes to use additional features. Expose different routes on different addresses so that internal and external users can see different routes, for example. Transfer traffic from one version of an application to another during a blue-green deployment. An additional use case is to isolate the control-plane Routes of the cluster and the application Routes in independent HA-proxy instances. This way it is not only it can be guaranteed different levels of reliability but also guaranteeing resource allocation for the cluster´s own traffic. In the section "Using additional Router instances" section below, it is shown how to do these configurations. Monitoring in a 2-tier deployment For each L7 route, regardless of the resource type used (Ingress, Route or VirtualServer), these share the same schema for monitoring. Next are shown the relevant parameters, where send is the key parameter that specifies L7 route: monitor: type: http send: "GET / HTTP/1.1\r\nHost: www.twotier.com\r\nConnection: close\r\n\r\n" recv: "^HTTP/1.1 200" In many cases, https will be used instead. HA-proxy requires that the health monitor uses TLS 1.2. By default, the https monitor defaults to TLS 1.0, hence we will need to specify one of the BIG-IP default TLS profiles as shown next: monitor: type: https send: "GET / HTTP/1.1\r\nHost: www.twotier.com\r\nConnection: close\r\n\r\n" recv: "^HTTP/1.1 200" sslProfile: /Common/serverssl When using NGINX or Istio ingress gateway, using TLS SNI (Server Name Indication) is requierd. In cases where SNI is required, the following needs to be done: One time, in TMM monitoring needs to be enabled as indicated in https://my.f5.com/manage/s/article/K85210713 For each FQDN it is needed to pre-create a server-side TLS profile in the partition /Common specifying the server name used as TLS SNI. The resulting monitor section will typically look as follows: monitor: type: https send: "GET / HTTP/1.1\r\nHost: www.twotier.com\r\nConnection: close\r\n\r\n" recv: "^HTTP/1.1 200" sslProfile: /Common/serverssl-www.twotier.com Note that this TLS profile is only needed for the monitoring, for application´s traffic the BIG-IP forwards the SNI received in the VIP. Alternative monitoring in a 2-tier deployment In this article, it is preferred to have 1:1 mapping between the L7 routes defined in the BIG-IP and the L7 routes defined in the ingress controller. It is possible to reduce the number of L7 routes and Service manifests for CIS by adding several monitors to a single L7 route manifest. For example we could have a single base L7 route such as www.twotier.com/ and several monitors probing the different applications behind this FQDN, for example: www.twotier.com/, www.twotier.com/account, and www.twotier.com/shop. This alternative monitoring can be configured with the following parameters: In this example, you can see how to create such a configuration. The preference for using a 1:1 mapping instead is because although this alternative strategy creates less manifests, automating the creation of these might be more complex. Additionally, it will be less easy to know in a given moment which applications are not working fine. Using OpenShift´s Router (HA-Proxy) in the second tier CIS can be configured to ingest F5 CRs, OpenShift Routes CRs or Ingress resources. When CIS is configured for using Routes or Ingress, by default HA-Proxy will also ingest these. In other words, both CIS and HA-Proxy will implement the same L7 routes. This behavior also applies to single-tier deployments where the behavior could be desired for testing. In general this behavior is not desired. HA-Proxy can be configured to do-not evaluate Routes or Ingress manifests with a given label or to do-not search for these in namespaces with a given label, for example "router=bigip". This behavior is configured in the IngressController resource type that manages HA-proxy's configuration: { "spec": { "namespaceSelector": { "matchExpressions": [ { "key": "router", "operator": "NotIn", "values": [ "bigip" ] } ] } } } This JSON configuration is applied with the next command for the default ingress controller/router in OpenShift: oc -n openshift-ingress-operator patch ingresscontroller default --patch-file=router-default.shard.json --type=merge More information on Route sharding can be found in this OpenShift document. Using the default Router instance OpenShift´s installer deploys the default HA-proxy instance with endpointPublishingStrategy type set to either hostNetwork or LoadBalancer. This will depend whether the OpenShift deployment is on-prem, in a public cloud, etc... This can be checked with the following command: oc get ingresscontrollers default -n openshift-ingress-operator -o jsonpath='{.status.endpointPublishingStrategy}{"\n"}' Regardless HA-proxy is configured with endpointPublishingStrategy either hostNetwork or LoadBalancer, CIS can be configured in clusterIP mode and refer to the HA-Proxy PODs using the "--orchestration-cni=ovn-k8s" and "--pool-member-type=cluster" options. The Service to refer to these HA-Proxy PODs will look as follows: apiVersion: v1 kind: Service metadata: name: router-default-route-a namespace: openshift-ingress spec: ports: - name: http port: 80 protocol: TCP targetPort: http - name: https port: 443 protocol: TCP targetPort: https selector: ingresscontroller.operator.openshift.io/deployment-ingresscontroller: default type: ClusterIP Where as indicated earlier there will be a Service manifest for each L7 route in order to have per L7 route monitoring. Note that these Services reside in the openshift-ingress namespace, where the HA-Proxy PODs are. Examples of this configuration can be found here using F5 CRs. Using additional Router instances Creating a new HA-Proxy instance just requires creating a new IngressController manifest in the openshift-ingress-operator namespace, such as the following sample: apiVersion: operator.openshift.io/v1 kind: IngressController metadata: name: shard-apps namespace: openshift-ingress-operator spec: clientTLS: defaultCertificate: name: router-shard-secret domain: shard-apps.com endpointPublishingStrategy: type: Private namespaceSelector: matchExpressions: - key: router operator: In values: - shard-apps replicas: 1 From this sample, note that: This new Router instance will evaluate only the L7 routes with namespaces with the label "router=shard-apps". the endpointPublishingStrategy is set to type Private, this is because we don´t need further exposure of it when CIS is accessing it in ClusterIP mode. When using an additional HA-proxy instance, the default Router will need to be instructed not to evaluate these same L7 routes as the additional HA-proxy instance. This is shown next: { "spec": { "namespaceSelector": { "matchExpressions": [ { "key": "router", "operator": "NotIn", "values": [ "bigip", "shard-apps" ] } ] } } } An example of this configurationcan be found here using Routes and multiple shards. Using Istio Ingress Gateway / OpenShift Service Mesh Using Istio (aka Service Mesh as packaged in OpenShift) in the second tier is straight-forward because Istio and CIS use different resource types for configuring L7 routes. A sample Service manifest to point to Istio ingress gateway is shown next apiVersion: v1 kind: Service metadata: name: svc-route-a namespace: istio-system spec: ports: - name: https port: 8443 protocol: TCP targetPort: https selector: app: istio-ingressgateway type: ClusterIP Where it can be observed that the Service manifests need to be created in the istio-system namespace and the selector needs to match the Istio ingress gateway´s Deployment's label. An example of this configuration can be found here using F5 CRs. Using NGINX Using NGINX in the second tier is much like using Istio, next is shown a sample Service manifest pointing to NGINX instances: apiVersion: v1 kind: Service metadata: name: svc-route-a namespace: nginx-ingress spec: ports: - name: https port: 443 protocol: TCP targetPort: 443 selector: app.kubernetes.io/instance: nginxingress-sample app.kubernetes.io/name: nginx-ingress type: ClusterIP The only special consideration to be considered, and only if both NGINX and CIS are meant to use the Ingress resource type, is to specify in the Ingress manifests which controller will ingest the manifest. This is specified with the ingressClassName attribute as shown next: in the case of NGINX apiVersion: networking.k8s.io/v1 kind: Ingress [...] spec: ingressClassName: nginx or in the case of CIS spec: ingressClassName: f5 An example of this configuration using F5 CRs in CIS and Ingress in NGINX can be found Using advanced BIG-IP services with CIS BIG-IP has many advanced services that can be easily referenced using F5 VirtualServer CRs, either directly in the manifest or referencing a Policy CR. When using Next Gen Routes these can also reference Policy CR but in a per router-group basis, hence having somewhat less granularity. Next is an overview of some of these advanced functionalities available. VirtualServer CR attributes for configuring advanced services Functionality attribute Advanced Web Application Firewall waf L3 anti-DoS protection dos L7 bot defense botDefense HTML content rewrite htmlProfile Custom iRules to perform advanced traffic management iRules Message routing framework (MRF) functionality for non HTTP traffic httpMrfRoutingEnabled IP intelligence ipIntelligencePolicy L3 Firewall rules firewallPolicy The configuration of these services must be pre-created in the BIG-IP as profiles in the /Common partition which can be referenced freely by CIS. It is expected that CIS 2.17 will incorporate APM and SSLo. Conclusion and closing remarks F5 BIG-IP is an External Loadbalancer with application awareness which allows to do advanced L7 services (not just TLS termination) and unify the different ingress paths into the cluster, allowing to merge several ingress controllers, API managers, service mesh or a combination of these. This solution is ingress type agnostic. A two-tier arrangement allows clean DevOps and NetOps separation. This is done by having separate L7 routes defined for the in-cluster ingress controllers and for the BIG-IPs. To continue your journey, please check the examples inthis GitHub repository using VirtualServer F5 CRs and OpenShift Route CRs.335Views0likes0Comments
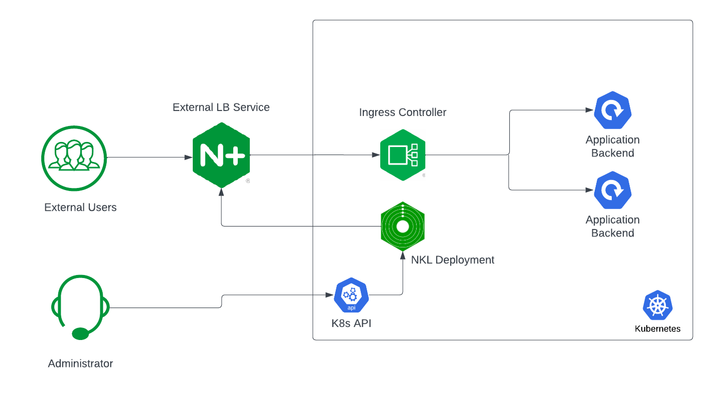
Securing and Scaling Hybrid Application with F5 NGINX (Part 1)
If you are using Kubernetes in production, then you are likely using an ingress controller. The ingress controller is the core engine managing traffic entering and exiting the Kubernetes cluster. Because the ingress controller is a deployment running inside the cluster, how do you route traffic to the ingress controller? How do you route external traffic to internal Kubernetes Services? Cloud providers offer a simple convenient way to expose Kubernetes Services using an external load balancer. Simply deploy a Managed Kubernetes Service (EKS, GKE, AKS) and create a Kubernetes Service of type LoadBalancer. The cloud providers will host and deploy a load balancer providing a public IP address. External users can connect to Kubernetes Services using this public entry point. However, this integration only applies to Managed Kubernetes Services hosted by cloud providers. If you are deploying Kubernetes in private cloud/on-prem environments, you will need to deploy your own load balancer and integrate it with the Kubernetes cluster. Furthermore, Kubernetes Load Balancing integrations in the cloud are limited to TCP Load Balancing and generally lack visibility into metrics, logs, and traces. We propose: A solution that applies regardless of the underlying infrastructure running your workloads Guidance around sizing to avoid bottlenecks from high traffic volumes Application delivery use cases that go beyond basic TCP/HTTP load balancing In the solution depicted below, I deploy NGINX Plus as the external LB service for Kubernetes and route traffic to the NGINX Ingress Controller. The NGINX Ingress Controller will then route the traffic to the application backends. The NLK (NGINX Load Balancer for Kubernetes) deployment is a new controller by NGINX that monitors specified Kubernetes Services and sends API calls to manage upstream endpoints of the NGINX External Load Balancer In this article, I will deploy the components both inside the Kubernetes cluster and NGINX Plus as the external load balancer. Note: I like to deploy both the NLK and Kubernetes cluster in the same subnet to avoid network issues. This is not a hard requirement. Prerequisites The blog assumes you have experience operating in Kubernetes environments. In addition, you have the following: Access to a Kubernetes environment; Bare Metal, Rancher Kubernetes Engine (RKE), VMWare Tanzu Kubernetes (VTK), Amazon Elastic Kubernetes (EKS), Google Kubernetes Engine (GKE), Microsoft Azure Kubernetes Service (AKS), and RedHat OpenShift NGINX Ingress Controller – Deploy NGINX Ingress Controller in the Kubernetes cluster. Installation instructions can be found in the documentation. NGINX Plus – Deploy NGINX Plus on VM or bare metal with SSH access. This will be the external LB service for the Kubernetes cluster. Installation instructions can be found in the documentation. You must have a valid license for NGINX Plus. You can get started today by requesting a 30-day free trial. Setting up the Kubernetes environment I start with deploying the back-end applications. You can deploy your own applications, or you can deploy our basic café application as an example. $ kubectl apply –f cafe.yaml Now I will configure routes and TLS settings for the ingress controller $ kubectl apply –f cafe-secret.yaml $ kubectl apply –f cafe-virtualserver.yaml To ensure the ingress rules are successfully applied, you can examine the output of kubectl get vs. The VirtualServer definition should be in the Valid state. NAMESPACE NAME STATE HOST IP PORTS default cafe-vs Valid cafe.example.com Setting up NGINX Plus as the external LB A fresh install of NGINX Plus will provide the default.conf file in the /etc/nginx/conf.d directory. We will add two additional files into this directory. Simply copy the bulleted files into your /etc/nginx/conf.d directory dashboard.conf; This will enable the real-time monitoring dashboard for NGINX Plus kube_lb.conf; The nginx configuration as the external load balancer for Kubernetes. You can change the configuration file to fit your requirements. In part 1 of this series, we enabled basic routing and TLS for one cluster. You will also need to generate TLS cert/keys and place them in the /etc/ssl/nginx folder of the NGINX Plus instance. For the sake of this example, we will generate a self-signed certificate with openssl. $ openssl req -x509 -nodes -days 365 -newkey rsa:2048 -keyout default.key -out default.crt -subj "/CN=NLK" Note: Using self-signed certificates is for testing purposes only. In a live production environment, we recommend using a secure vault that will hold your secrets and trusted CAs (Certificate Authorities). Now I can validate the configuration and reload nginx for the changes to take effect. $ nginx –t $ nginx –s reload I can now connect to the NGINX Plus dashboard by opening a browser and entering http://<external-ip-nginx>:9000/dashboard.html#upstreams The HTTP upstream table should be empty as we have not deployed the NLK Controller yet. We will do that in the next section. Installing the NLK Controller You can install the NLK Controller as a Kubernetes deployment that will configure upstream endpoints for the external load balancer using the NGINX Plus API. First, we will create the NLK namespace $ kubectl create ns nlk And apply the RBAC settings for the NKL deployment $ kubectl apply -f serviceaccount.yaml $ kubectl apply -f clusterrole.yaml $ kubectl apply -f clusterrolebinding.yaml $ kubectl apply -f secret.yaml The next step is to create a ConfigMap defining the API endpoint of the NGINX Plus external load balancer. The API endpoint is used by the NLK Controller to configure the NGINX Plus upstream endpoints. We simply modify the nginx-hosts field in the manifest from our GitHub repository to the IP address of the NGINX external load balancer. nginx-hosts: http://<nginx-plus-external-ip>:9000/api Apply the updated ConfigMap and deploy the NLK controller $ kubectl apply –f nkl-configmap.yaml $ kubectl apply –f nkl-deployment I can verify the NLK controller deployment is running and the ConfigMap data is applied. $ kubectl get pods –o wide –n nlk $ kubectl describe cm nginx-config –n nlk You should see the NLK deployment in status Running and the URL should be defined under nginx-hosts. The URL is the NGINX Plus API endpoint of the external load Balancer. Now that the NKL Controller is successfully deployed, the external load balancer is ready to route traffic to the cluster. The final step is deploying a Kubernetes Service type NodePort to expose the Kubernetes cluster to NGINX Plus. $ kubectl apply –f nodeport.yaml There are a couple things to note about the NodePort Service manifest. Fields on line 7 and 14 are required for the NLK deployment to configure the external load balancer appropriately: The nginxinc.io/nkl-cluster annotation The port name matching the upstream block definition in the NGINX Plus configuration (See line 42 in kube_lb.conf) and preceding nkl- apiVersion: v1 kind: Service metadata: name: nginx-ingress namespace: nginx-ingress annotations: nginxinc.io/nlk-cluster1-https: "http" # Must be added spec: type: NodePort ports: - port: 443 targetPort: 443 protocol: TCP name: nlk-cluster1-https selector: app: nginx-ingress Once the service is applied, you can note down the assigned nodeport selecting the NGINX Ingress Controller deployment. In this example, that node port is 32222. $ kubectl get svc –o wide –n nginx-ingress NAME TYPE CLUSTER-IP PORT(S) SELECTOR nginx-ingress NodePort x.x.x.x 443:32222/TCP app=nginx-ingress If I reconnect to my NGINX Pus dashboard, the upstream tab should be populated with the worker node IPs of the Kubernetes cluster and matching the node port of the nginx-ingress Service (32222). You can list the node IPs of your cluster to make sure they match the IPs in the dashboard upstream tab. $ kubectl get nodes -o wide | awk '{print $6}' INTERNAL-IP 10.224.0.6 10.224.0.5 10.224.0.4 Now I can connect to the Kubernetes application from our local machine. The hostname we used in our example (cafe.example.com) should resolve to the IP address of the NGINX Plus load balancer. Wrapping it up Most enterprises deploying Kubernetes in production will install an ingress controller. It is the DeFacto standard for application delivery in container orchestrators like Kubernetes. DevOps/NetOps engineers are now looking for guidance on how to scale out their Kubernetes footprint in the most efficient way possible. Because enterprises are embracing the hybrid approach, they will need to implement their own integrations outside of cloud providers. The solution we propose: is applicable to hybrid environments (particularly on-prem) Sizing information to avoid bottlenecks from large traffic volumes Enterprise Load Balancing capabilities that stretch beyond a TCP LoadBalancing Service In the next part of our series, I will dive into the third bullet point into much more detail and cover Zero Trust use cases with NGINX Plus, providing extra later of security in your hybrid model.195Views0likes0Comments- 193Views1like0Comments